

When the Forecast Are Wrong: What Adversarial Stress Testing Reveal About Concentrated AI Portfolios
By Team Acumentica
When the Forecast Are Wrong: What Adversarial Stress Testing Reveal About Concentrated AI Portfolios
Executive Summary
We gave a standard portfolio optimizer seventeen AI stocks and asked for its best risk-adjusted portfolio. It put 56% of the capital into three names: Amazon, Alphabet and Meta. Amazon alone carried nearly 30% of the portfolio’s total risk.
Then we attacked the portfolio. Inside Acumentica’s Investment Decision ControlOS, we ran an adversarial stress test that assumes the forecasts are wrong and searches for the damage. Returns fall. Volatility jumps. Stocks start moving together. Liquidity dries up. Then all of it at once.
A robust allocation, built to survive bad forecasts, cut the three hyperscalers from 56% to about 12% of the portfolio. It nearly doubled effective diversification. It carried 11% to 17% lower volatility in every scenario we tested, and it delivered better risk-adjusted returns in all six. The cost was about one percentage point of expected return.
The test also showed what better weights cannot do. When stocks move together, most of the robust portfolio’s edge disappears. And in a 1-in-20 year, the standard portfolio still loses more than 41%. Smarter weights get a portfolio most of the way. Decision Control has to close the rest.
Introduction
History teaches us what has happened. It cannot tell us what will.
In our first two studies, we showed how a governed portfolio behaved through real crises: the global financial crisis, the 2022 tech drawdown and the dot-com bust. That evidence matters. But every CIO who reads it eventually asks the harder question.
What about the crisis that hasn’t happened yet?
The next unwind of the AI trade will not be a rerun of 2000 or 2022. It will have its own shape. Correlations may spike faster. Liquidity may vanish in places no one expected. Return assumptions that look reasonable today may prove badly wrong.
A backtest cannot test for that. So we ran a different kind of test. Instead of replaying history, we went looking for trouble. We asked: if our forecasts are wrong, how wrong can they get, and does the portfolio survive?
The answer exposed a risk most portfolios carry without knowing it.
The Setup
We started with seventeen AI-related stocks, the kind of basket that defines AI exposure for many institutional portfolios. It includes Nvidia, Microsoft, Alphabet, Amazon, Meta, Broadcom, TSMC and Palantir, alongside long-standing technology names such as Cisco, IBM, Intel, Qualcomm, Dell and HP.
We built two portfolios from the same stocks:
- Standard: a classic optimizer, set to find the best risk-adjusted portfolio based on its forecasts. This is how a large share of the industry still builds portfolios. It ran without any decision control layer.
- Robust: an allocation built to hold up when those forecasts are wrong. Instead of trusting its estimates, it plans for them to miss.
Then we stressed both portfolios across six scenarios:
- Normal conditions, with no shock
- Returns fall, as expected returns revert lower
- Volatility jumps across the basket
- Stocks move together, as correlations spike
- Liquidity dries up
- All of the shocks combined
We also simulated 500 one-year paths of the standard portfolio under stressed conditions to see how deep its drawdowns could run.
One point matters for reading what follows. This is a forward-looking stress test, not a backtest. It does not tell you what happened. It tells you what could happen, and how each portfolio is built to respond.
We used the same seventeen stocks from our prior AI concentration study. Nvidia, Microsoft, Google, Meta, Amazon, Broadcom, AMD, TSMC, Oracle, Palantir, Intel, IBM, Cisco, Apple, and three adjacent names. These are the stocks that define today’s AI exposure for most institutional portfolios.
The historical period was the dot-com bust itself: March 2000 through October 2002. Benchmark was QQQ, the tech-heavy index.Preset was Growth Governance, matching the stance of an investor who wants participation in the upside, not a defensive crouch.
Rebalancing was monthly.
The backtest was walk-forward. At every rebalancing point, the system only used information that would have been available on that date. No lookahead. No hindsight. No curve-fitting.
This analysis was conducted using Acumentica’s Behavioral & Adversarial Resilience ControlOS, which allows CIO’s to evaluate how a concentrated portfolio would behave when its own forecasts are wrong: when returns fall short, volatility jumps, stocks move together and liquidity dries up.
The objective was not to predict a market decline. The objective was to expose the fragility hidden inside a portfolio before capital is committed, and to show where better portfolio construction stops working and decision control has to take over.
The Chart
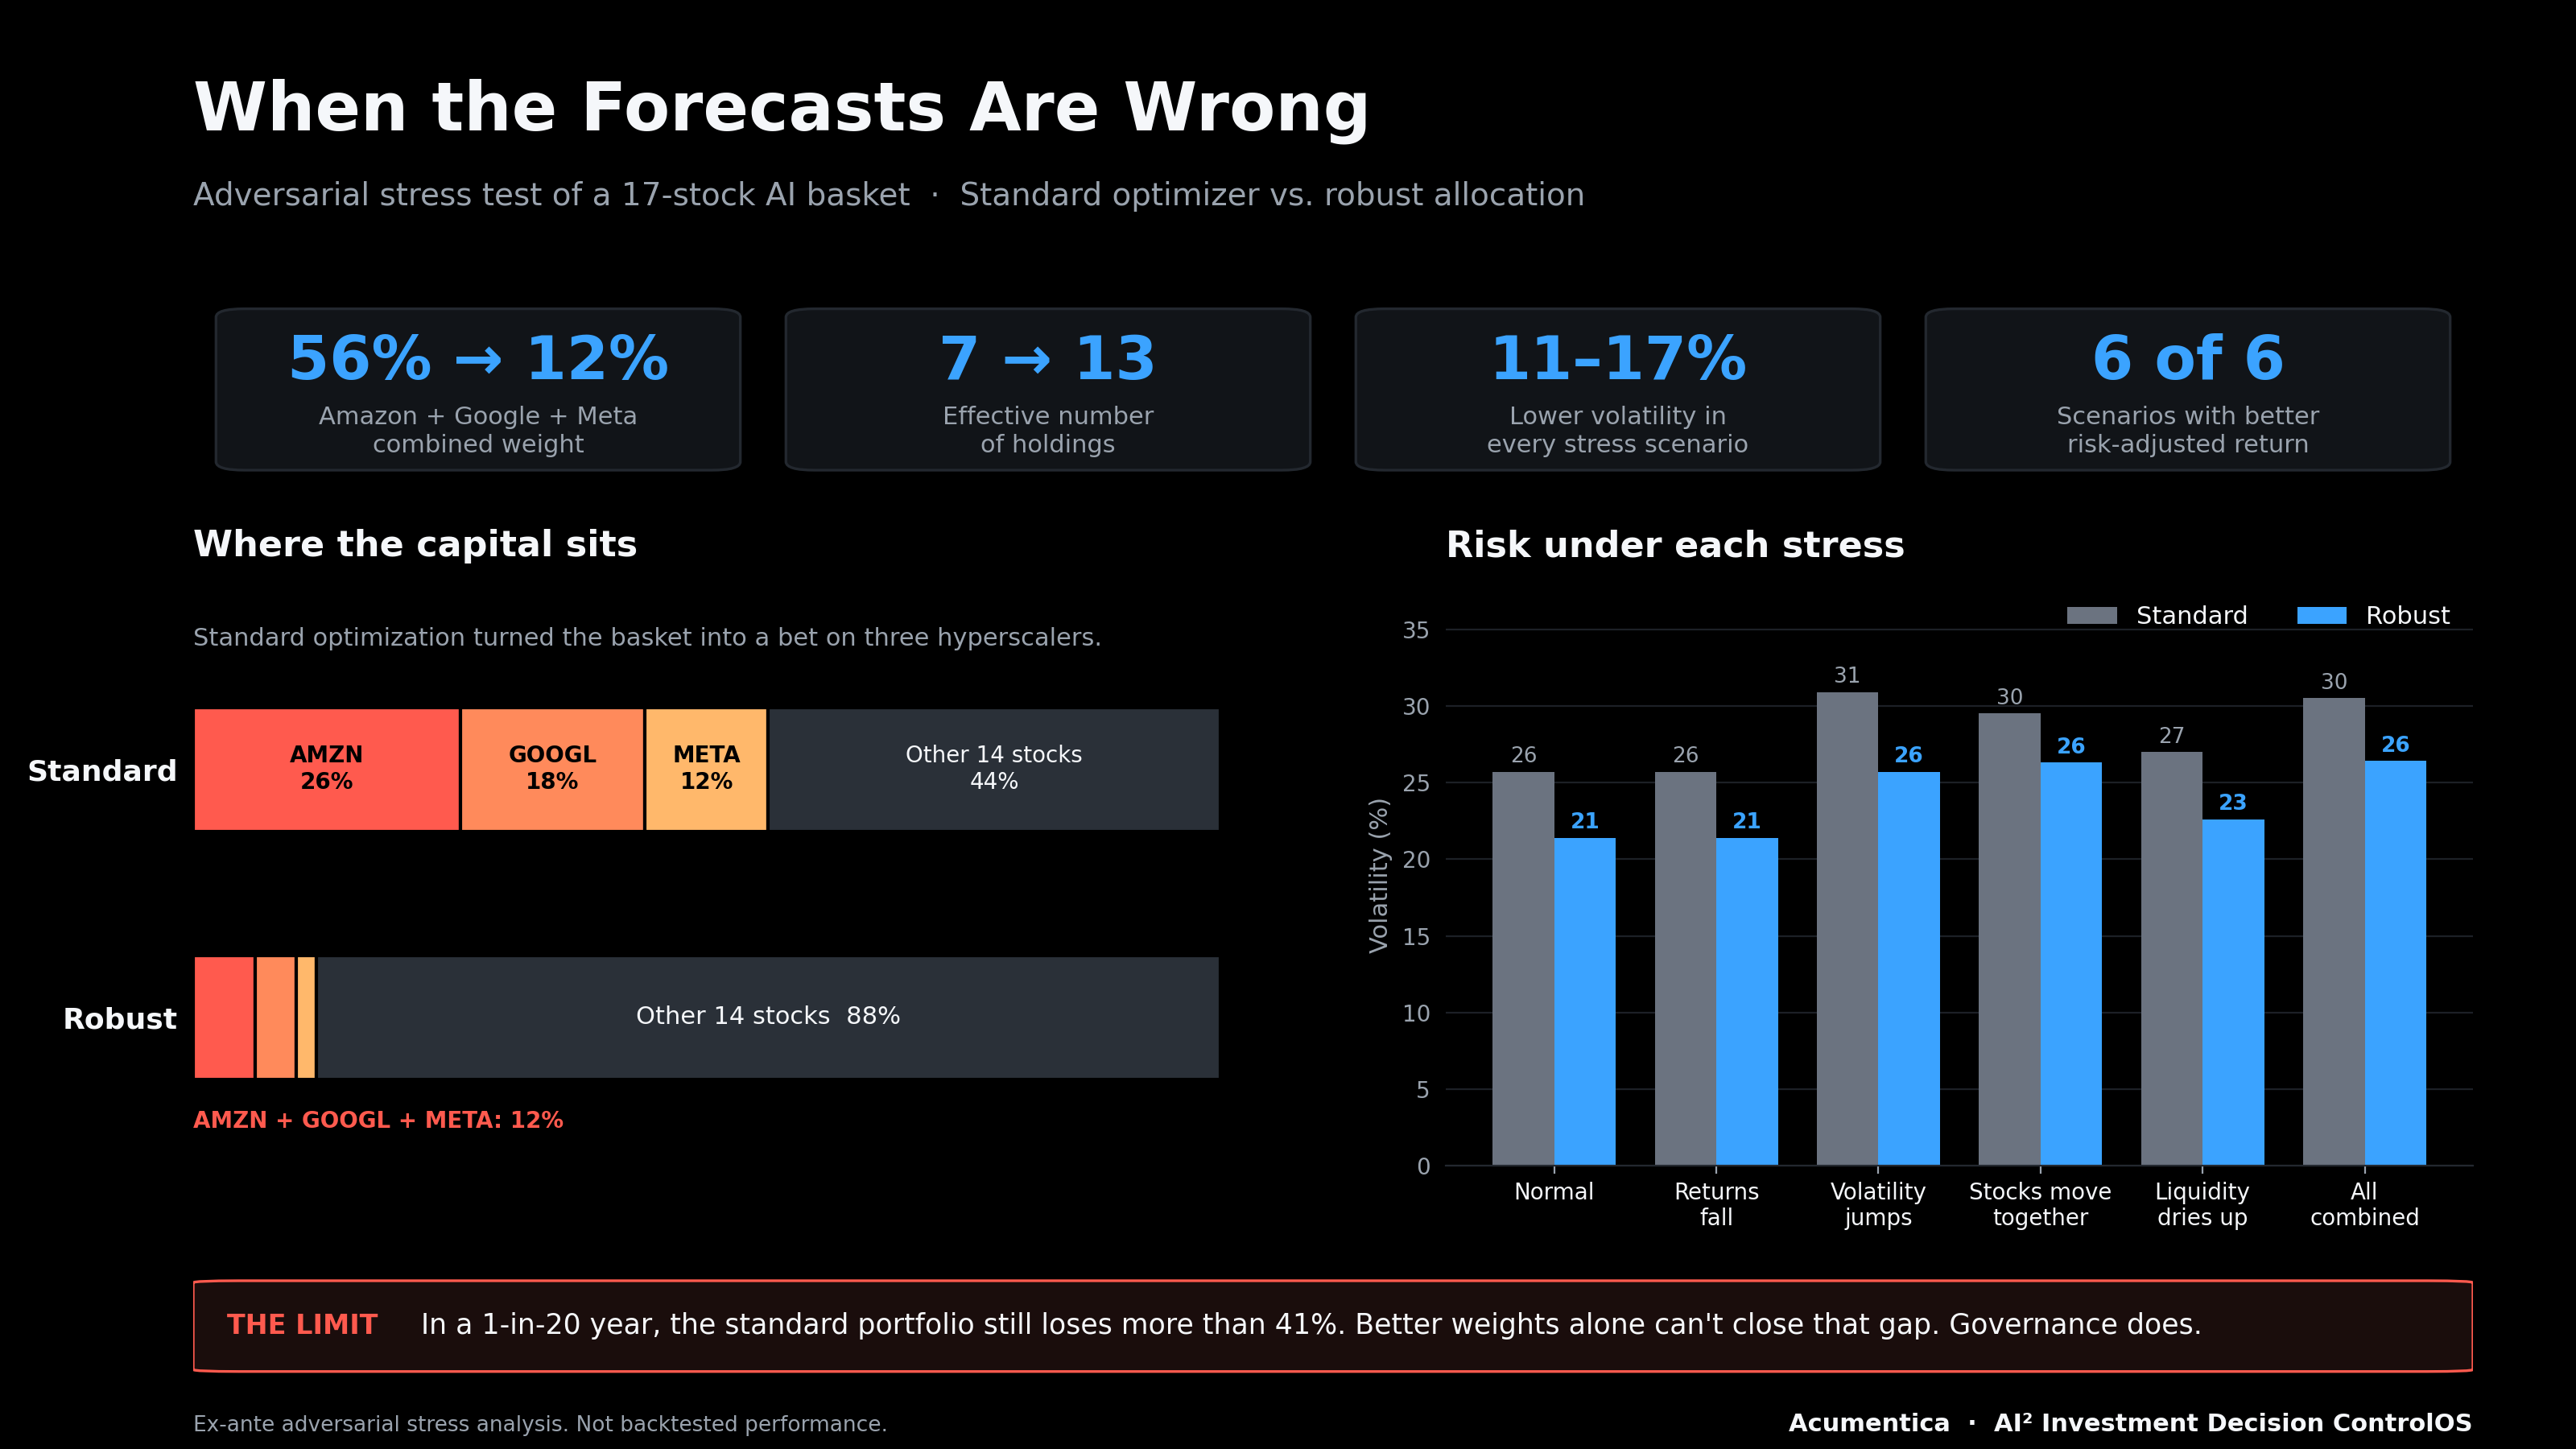
Ex-ante adversarial stress analysis on a 17-stock AI basket. Not backtested performance. Does not guarantee future results.
The left panel shows where the capital sits, with Amazon, Alphabet and Meta in red and orange. The right panel shows the risk each portfolio carries under each stress: grey for the standard portfolio, blue for the robust allocation. The red box at the bottom shows what neither set of weights can fix on its own.
Finding 1: The Optimizer Built a Three-Stock Bet
17 stocks went in. The standard optimizer behaved as if there were seven.
Holding | Share of capital | Share of portfolio risk |
|---|---|---|
| Amazon | 26.1% | 29.5% |
| Alphabet | 17.5% | 16.4% |
| Meta | 12.5% | 13.2% |
| Top three combined | 56.1% | 59.1% |
Those three names held more than half the capital and carried almost 60% of the risk. Measured by effective number of holdings, a standard way to account for how unevenly money is spread, the seventeen-stock portfolio behaved like a seven-stock portfolio.
The system’s fragility scoring flagged the same problem from a different angle. Amazon scored 66.5 out of 100, the only holding rated high risk. Alphabet and Meta followed at 51.1 and 39.1, both rated medium. Every other holding scored low.
This is not a flaw in the stocks. These are extraordinary businesses. It is a flaw in how the optimizer treats its own forecasts. It trusts them completely. The names with the best-looking expected returns get the most capital, and those are precisely the forecasts most likely to be wrong.
In a crowded trade, that is the trap. The tool most portfolios use to manage risk was quietly concentrating it.
Finding 2: Assuming the Forecasts Are Wrong Spreads the Bet
The robust allocation asks a different question. Not “what is the best portfolio if my forecasts are right?” but “what is the best portfolio if they are wrong?”
Given the same seventeen stocks, it made very different choices. Amazon fell from 26.1% to 5.9% of the portfolio. Amazon, Alphabet and Meta together fell from 56% to about 12%. The largest single holding became Cisco at 12.1%, and no position exceeded that.
Effective diversification nearly doubled, from about seven holdings to about thirteen.
The robust portfolio did not abandon AI. Every holding still comes from the same seventeen-stock AI basket. It simply refused to let three forecasts carry the whole portfolio.
There was also a clear pattern in the cost of that caution. Across the full range of portfolios the optimizer could build, the gap between expected and worst-case returns averaged 3.58 percentage points. That gap widened as portfolios reached for higher returns. Put plainly, the top of the AI efficient frontier is not where the returns are. It is where the estimation error is.
Finding 3: Lower Risk in Every Scenario
The robust portfolio carried less risk than the standard portfolio in all six scenarios.
| Scenario | Standard volatility | Robust volatility | Risk-adjusted return (standard → robust) |
|---|---|---|---|
| Normal conditions | 25.7% | 21.4% | 0.59 → 0.64 |
| Returns fall | 25.7% | 21.4% | 0.40 → 0.43 |
| Volatility jumps | 30.9% | 25.7% | 0.49 → 0.54 |
| Stocks move together | 29.5% | 26.3% | 0.51 → 0.52 |
| Liquidity dries up | 27.0% | 22.6% | 0.54 → 0.58 |
| All shocks combined | 30.5% | 26.4% | 0.40 → 0.42 |
Volatility was 11% to 17% lower across the board. Risk-adjusted return, measured as Sharpe ratio against a 5% cash rate, was higher in every scenario.
The price was consistent too. In each scenario, the robust portfolio’s expected return sat 1.0 to 1.3 percentage points below the standard portfolio’s. For every point of return given up, it removed about three and a half points of volatility on average.
We want to be precise about the size of the edge. The risk-adjusted improvements are real but modest, between 0.01 and 0.05. The bigger story is not a higher Sharpe ratio. It is a portfolio that no longer depends on three forecasts being right.
Finding 4: Where Better Weights Stop Working
This is the part most vendors leave out. We think it is the most important part.
When stocks move together, the edge almost disappears. In the correlation-spike scenario, the standard portfolio’s volatility rose about 15%. The robust portfolio’s rose about 23%. Its risk-adjusted advantage shrank to just 0.01.
The reason is simple. The robust portfolio earns its lower risk by spreading capital across stocks that usually don’t move in lockstep. When correlations converge, that diversification evaporates. The concentrated portfolio had less diversification to lose in the first place. It is the oldest lesson in risk management: diversification tends to fail exactly when you need it.
The drawdown tail stays deep. Across 500 simulated one-year paths under stressed conditions, the standard portfolio’s maximum drawdown looked like this:
| Outcome | Maximum drawdown |
|---|---|
| Typical year (median) | 24.3% |
| 1-in-20 year (95th percentile) | 41.4% |
| 1-in-100 year (99th percentile) | 46.4% |
Even the typical stressed year cost nearly a quarter of the portfolio at its worst point. The median path still ended the year up 14.7%, which shows how violent the ride can be on the way to a positive result. Clients rarely sit through a 41% drawdown long enough to collect it.
No amount of clever weighting removes that risk from an all-AI basket. Weights decide what you own. They cannot decide how much you should own when the regime turns.
What Makes This Different
Most risk systems fail during crises because they were calibrated during calm.
Investment Decision ControlOS was built from the opposite direction. The system was designed to govern exposure through regime change; specifically, to detect when the market environment that justified a given level of risk has stopped existing.
That matters here because the risks this test exposed are not single events. A forecast that quietly goes wrong, correlations that converge, liquidity that thins out: each one changes the regime a portfolio is operating in. A standard optimizer keeps fitting to the old regime. It keeps trusting the forecasts that built its weights, even as the conditions behind those forecasts fall apart. By the time most risk systems notice, the drawdown has already compounded.
Decision Control is different from prediction.
Prediction attempts to determine what the market will do next.
Decision Control determines how exposure should be governed when the market environment changes.
Decision Control preserves optionality when the regime changes. It reduces exposure when the conditions that justified exposure have deteriorated. It does this using observable, measurable signals from market behavior itself; volatility, correlation and dispersion; rather than opinions about where prices should be.
This is why the test above matters. Robust weights reduce how much a portfolio depends on any one forecast. But weights are set in advance. When stocks start moving together and drawdowns deepen, the weights cannot respond. Decision Control can, because it adjusts how much capital is at risk as conditions change.
According to Acumentica’s Decision Control Research Lab, many of the largest losses in institutional portfolios occur not because investors lack intelligence, but because exposure remains tied to assumptions that no longer match the active market regime. This is a form of Exposure Drift, one of the core pathways identified in Acumentica’s Drift Index: Six Pathways of Institutional Drift. It is also one of the core challenges addressed by SI Governance, where decision systems must remain governed as operating conditions change.
The hidden concentration in this test is Exposure Drift in its quietest form. Nobody chose to put 56% of the portfolio into three stocks. The optimizer drifted there on its own, following forecasts that looked reasonable at the time.
That principle is what separates Capital Decision Control Infrastructure from traditional risk analytics.
Traditional risk analytics observe exposure.
Decision Control governs it.
Why This Matters for CIOs
Most portfolios rely on two things to manage risk: an optimizer and judgment. This test shows the limits of both.
The optimizer, left alone, concentrated the portfolio in the most crowded names. A CIO looking at a seventeen-stock holdings list would reasonably assume it was diversified. It was not. The fragility was hidden inside the weights, invisible until someone went looking for it.
Judgment has a different weakness. It updates slowly during regime transitions, because people anchor to the environment they have most recently experienced. By the time conviction catches up with conditions, much of the damage has already compounded.
Robust allocation fixes the first problem. It removes the hidden concentration and lowers risk across every scenario we tested. But it cannot fix the second. When correlations converge and drawdowns deepen, the question is no longer which stocks to own. It is how much to have at risk at all.
That is the job of Decision Control. Investment Decision ControlOS adjusts exposure as market conditions change, using observable signals rather than forecasts. It does not replace the portfolio manager. It gives the PM a governed, auditable decision pathway that is already working when the environment shifts. Our earlier studies showed what that looked like through real crises. This study shows why it is needed even after the weights have been made smarter.
The principle at the center of Acumentica’s Decision Control Research Lab is simple. Robust weights get you most of the way. The last mile is Decision Control.
Investment Decision ControlOS is a modern implementation of that principle. It operates as a sovereign Decision Control system that continuously governs exposure based on observable regime signals, independent of narrative conviction. It does not replace the PM. It is operator-led, and gives the PM a decision pathway that is auditable, reproducible and already governed when the environment changes.
What This Test Does and Does Not Show
This test does not predict that the AI trade will unwind. AI adoption may keep accelerating, and today’s leaders may keep growing into their valuations. We don’t forecast markets.
It is not a backtest either. The numbers describe how two portfolios are built to respond to hostile conditions, not returns anyone earned. They are ex-ante, and they do not guarantee future results.
What the test does show is concrete and checkable:
- A standard optimizer can turn a diversified-looking AI basket into a concentrated bet on three names.
- Planning for forecast error removes most of that concentration and lowers risk in every scenario tested, at a cost of about one percentage point of expected return.
- Better weights alone do not protect a concentrated AI portfolio when stocks fall together or when drawdowns run deep.
The first two points are an argument for smarter portfolio construction. The third is an argument for decision control.
What To Do Next
If you hold concentrated AI exposure today, one question is worth answering before the market answers it for you: how much of your portfolio’s diversification is real?
We will run your actual portfolio through the same adversarial stress test shown here. Your holdings, your weights, your mandates. We will show you where the hidden concentration sits, how your portfolio behaves when the forecasts are wrong, and what decison control would change.
The goal is not to sell software. The goal is to find the fragility before it costs capital.
No sales pitch. Just evidence. Request A Decision Control Walkthrough →
AI² Investment Decision ControlOS is developed and operated by Acumentica. Portfolio managers retain full decision authority while operating within governed decision pathways. Results shown are from an ex-ante adversarial stress analysis on a 17-stock AI basket, not backtested or live performance. Sharpe ratios use a 5% cash rate. For informational and research purposes only. Past or simulated results do not guarantee future results. Investment decisions involve risk, including possible loss of capital.
Learn More
Explore how the Behavioral & Adversarial Resilience ControlOS the resilience layer behind this study.
Explore how the Capital Decision Control Infrastructure — Category Anchor establishes the decision control environment that all enterprise and capital systems operate within.
Learn how the Capital Decision Control Infrastructure — Definition formalizes the discipline of governed intelligence and the fourth‑layer architecture that stabilizes enterprise decision pathways.
Learn how the Agentic AI Control OS stabilizes agentic systems under real‑world constraints.
Decision Control Research Lab
The Decision Control Research Lab researches drift, collapse dynamics, and the Decision‑Control layer; the institutional execution‑governance systems that keep autonomous and enterprise systems stable, aligned, and protected from drift‑driven failure.
Read the companion study: If the AI Trade Breaks, Your Portfolio Doesn’t Have To. Evidence From 21 Years of Market Stress
Read the companion study: When The Tech Last Broke. What The Dot-Com Tells Us About The AI Bubble. Investment Decision ControlOS
AI Bubble: Why Investors Should Grab Popcorn Before The Credits Roll
Governed Pathways For Navigating Market Regimes
The CIO Boundary: Why AI Cannot Govern Capital Systems
Why Safety AI Fails Without Regime Adaptation
Sovereign Financial SI – The Domain Where Super Intelligence Becomes Sovereign
Constraint Integrity: Why Enterprise Systems Break Without Deterministic Systems
AI Warning Sign: Cutting Through The Marketing Fluff With Decision Control Discipline
Governed Agentic Enterprise OS | Governing Enterprise Decisions Under Uncertainty
Capital Decision Control Infrastructure | Governing Decision Behavior Under Pressure
Governed Risk and Compliance Decision Control OS
Prescriptive Decision ControlOS: Governing Next actions, Strategic Alignment and Execution Discipline
Investment Research Governance ControlOS: Governing Research Direction & Exploration in Runtime
Portfolio Governance ControlOS: Preventing Portfolio Drift in Runtime
Risk Governance ControlOS: Runtime Enforcement of Institutional Risk Boundaries
AI Hallucination Drift: When AI Creates False Decisions That Break Institutional Governance
Risk Governance: Preventing drift and overrides in Agentic AI execution
Portfolio Drift: When construction and allocation quietly break strategy
Decision Drift: The Institutional Instability CIOs Can’t See
Portfolio Governance: Stabilizing Investment Decisions in Agentic AI Systems
Why Investment Teams Fail: The Missing Governance Layer
What is Capital Decision Control Infrastructure? The New Architecture Wall Street and Enterprises Will Need
The Missing Layer Between Research and Execution: Decision Control
Why Investment Team Drift Under Uncertainty (and How to Stop It)
About Acumentica
Acumentica is a Precision AI-powered Capital Decision Control Infrastructure company.
We help institutions make better decisions under uncertainty and avoid costly mistakes by transforming complex data, risk, and constraints into clear, disciplined next actions. Request A Decision Control Walkthrough →
Acumentica is the steering and braking layer above Intelligence; the part that governs what intelligence does, not just what it predicts.
Acumentica originated the Capital Decision Control Infrastructure and built the first product in that category; the Decision Control OS. We are the first company to introduce governed capital‑control as a market and technology category thesis.
Glossary Reference
See Acumentica’s [Glossary] for canonical definitions.
Decision Control OS: is the operating system that governs SI‑class systems, enforcing constraints, stabilizing execution, and preventing drift across enterprise and national infrastructures.
SI (Superintelligence): intelligence that operates at sovereign‑scale or enterprise‑scale with the ability to govern execution across mandates, constraints, boundaries, exposures, and fiduciary obligations. SI‑class systems require deterministic governance to prevent drift, override, hallucination, and instability.
SI Governance: the discipline that enforces constraints deterministically across enterprise, capital, and national systems to keep superintelligence‑class execution aligned, stable, drift‑free, and mandate‑compliant. It governs future‑intelligence classes, including superintelligence and sovereign‑scale intelligence.
Control Plane: The governance layer that directs agentic systems.
Closed Loop: A feedback system ensuring accountability and correction.
Governed Intelligence: AI systems operating under explicit decision‑control rules.
AI: is task‑level intelligence that performs localized, probabilistic actions such as generating text, classifying data, or automating workflows.
Constraint Integrity: is the enterprise’s ability to enforce constraints deterministically so systems remain aligned with mandates, boundaries, and fiduciary obligations under all conditions.
Institutional Drift: is the silent misalignment that occurs when systems deviate from mandates and constraints, accumulating exposure over time.
Deterministic Governance: ensures systems always obey constraints and mandates, producing stable, predictable, and aligned execution.
Probabilistic AI: generates actions based on statistical inference rather than constraints, making its behavior non‑deterministic and non‑governing.